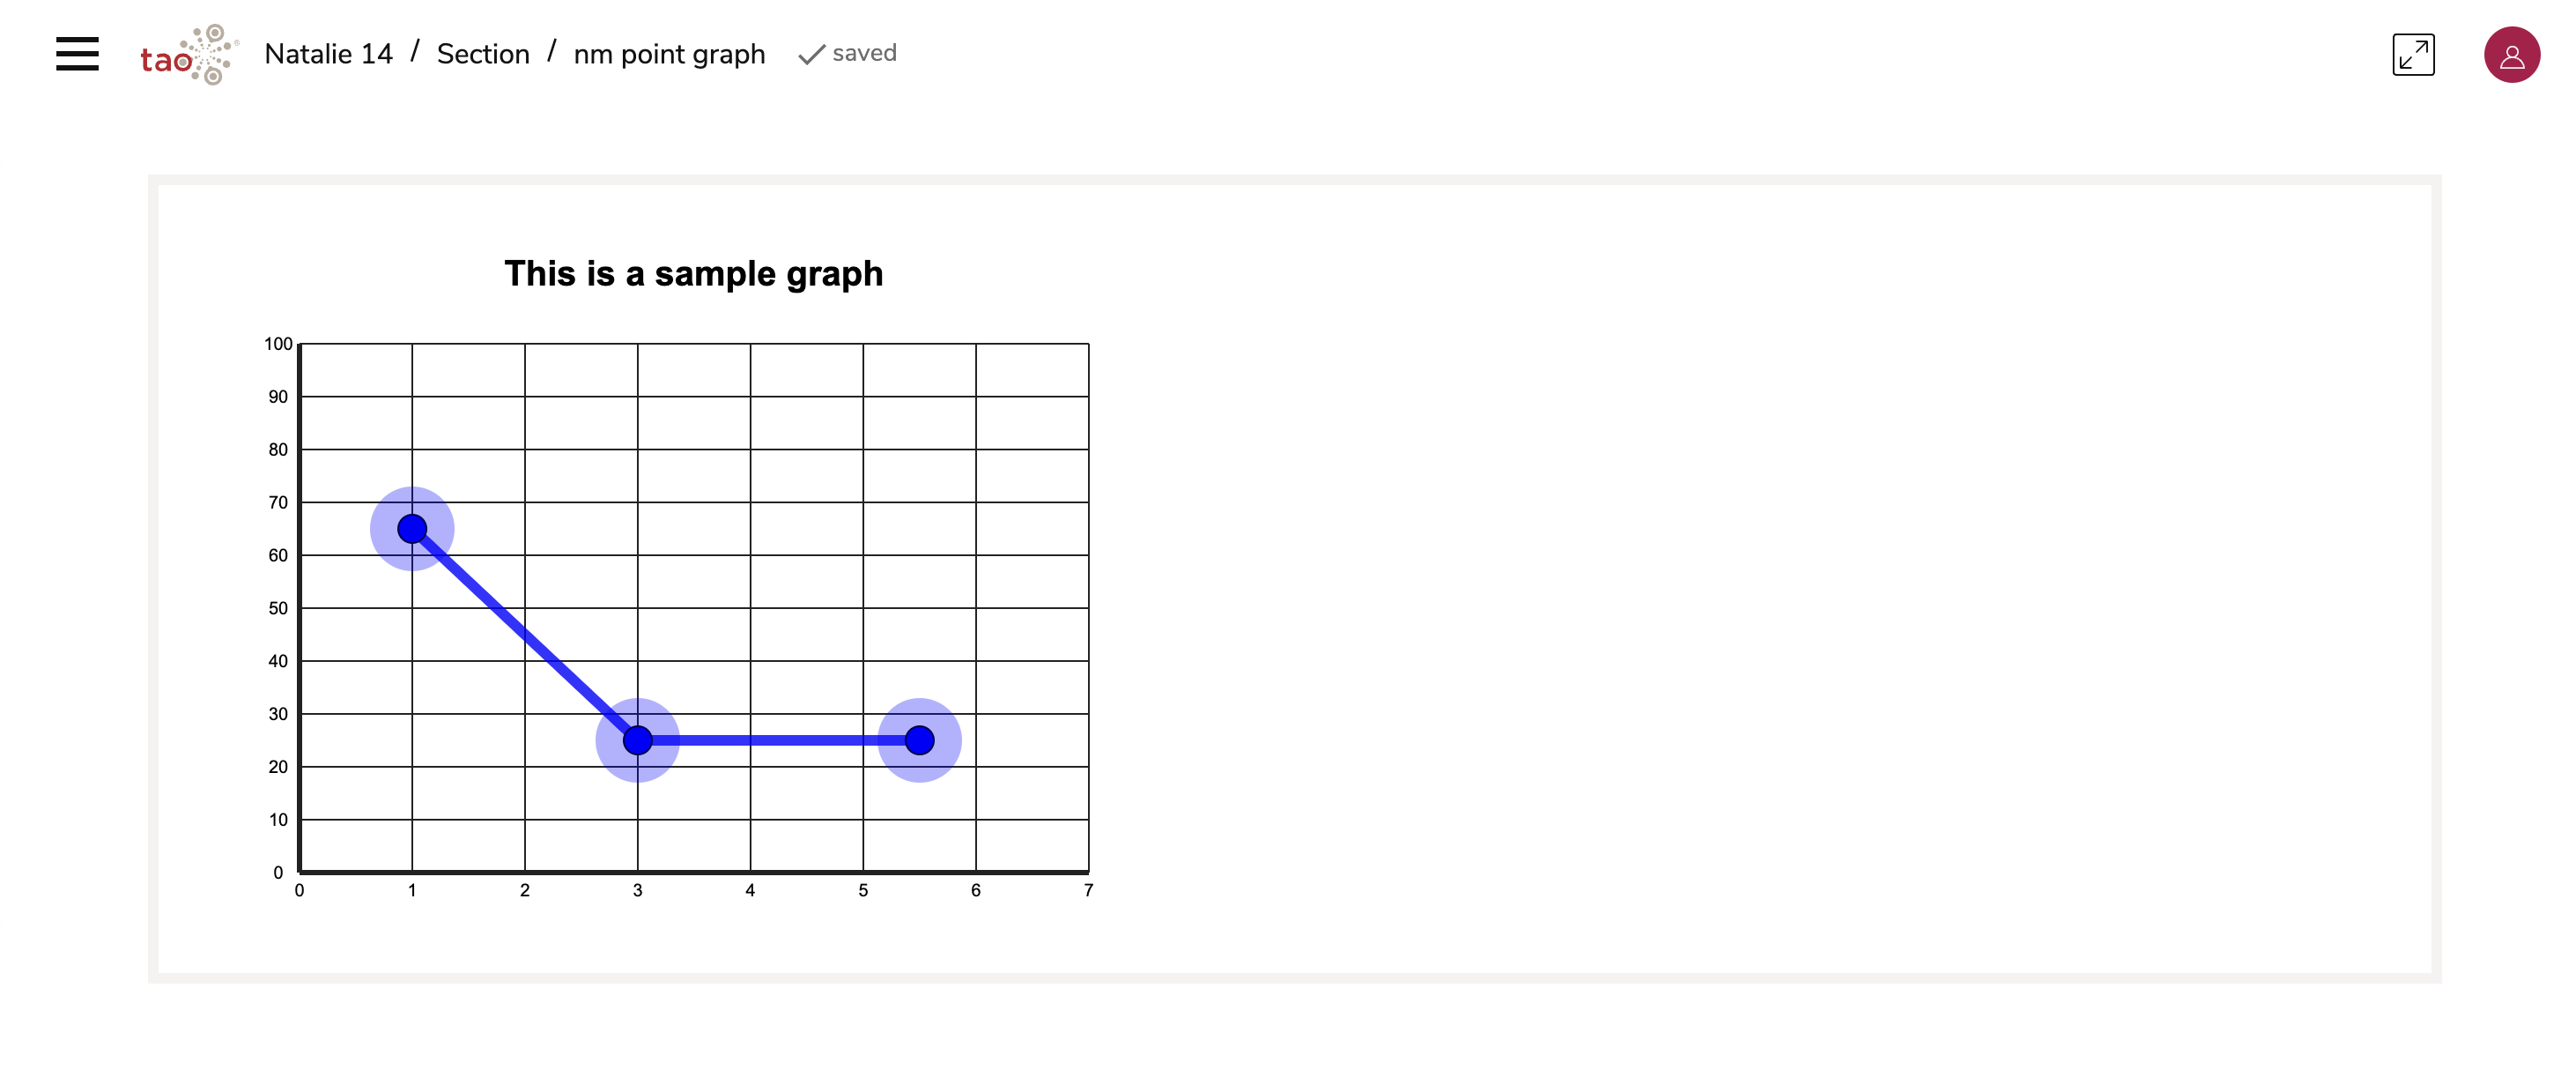
A Point Graph interaction is useful if you would like the Test-taker to provide an answer as a set of points visually on a graph. The Point Graph Interaction is one of the Portable Custom Interactions in the standard TAO package.
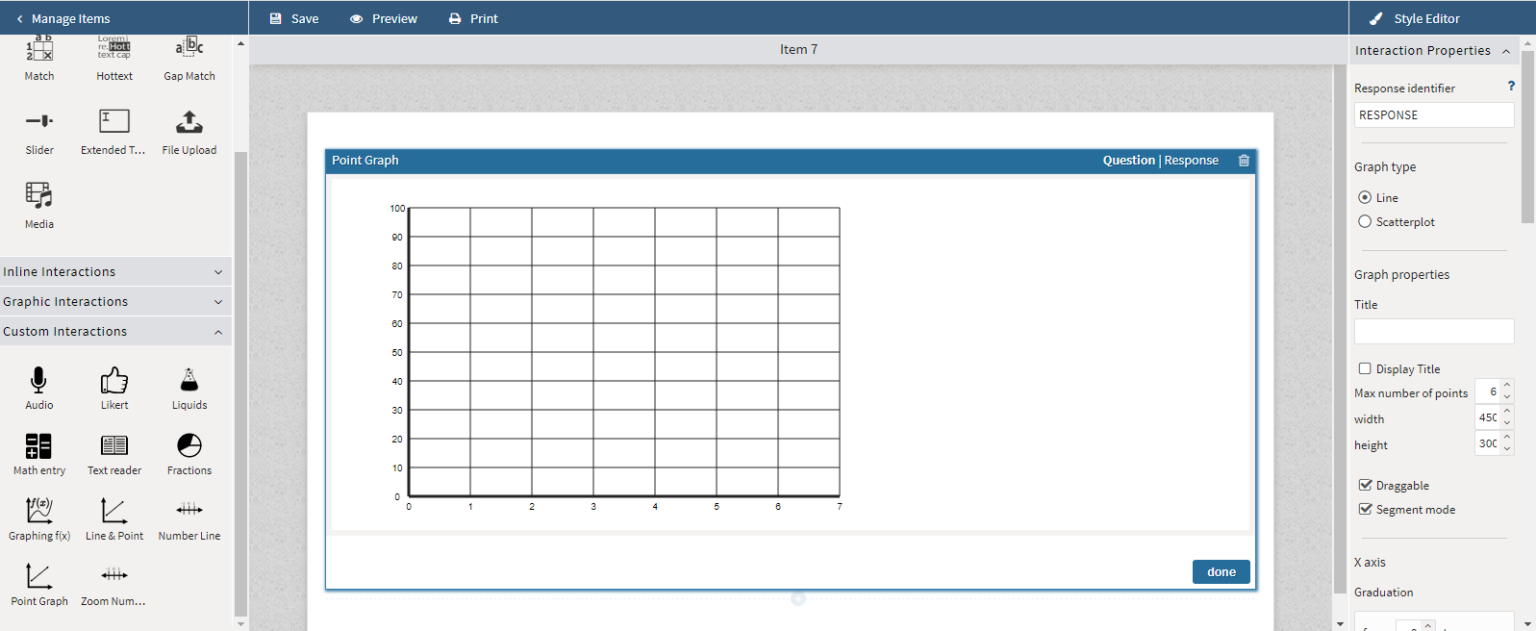
1. Under Interaction Properties, configure the interaction’s display and functionality properties.
Under Interaction Properties, the following aspects of the interaction are configurable:
-
Graph type: Select either line or scatterplot (depending on the type of response the test-taker should produce).
-
Graph properties
-
Title: Enter in the text box the title of the graph (usually related to what the test-taker will produce). Check Display Title for the title to be visible above the graph.
-
Max number of points: Adjust this number according to how many points the test taker can select on the graph to produce the correct answer.
-
Width/height: Adjust the width and height of the graph.
-
Draggable: Check this box so the selected points on the graph may be dragged to be moved (as opposed to deselect → reselect).
-
Segment mode: Check this box so the selected points form a contained segment (as opposed to lines that span the whole graph).
-
X axis: For the graph’s horizontally line, adjust the numerical range (and the increment by which each number is to increase/decrease) to be displayed in the Graduation section.
-
Title: Enter the title of the X axis. This will display horizontally under the graph.
-
Label: Enter the label of the X axis. This will display adjacent to the x axis number line.
-
-
Y axis: For the graph’s vertical line, adjust the numerical range (and the increment by which each number is to increase/decrease) to be displayed in the Graduation section.
-
Title: Enter the title of the Y axis. This will display vertically to the left of the graph.
-
Label: Enter the label of the X axis. This will display above the y axis number line.
-
-
Graph Appearance: In this section, you can adjust the visual elements of the graph.
-
Static points: Select Add static point to create a non-adjustable point on the graph. Context may be added to this point in the Label text box. Adjust where on the graph this point should appear in the X and Y boxes.
-
The appearance of the graph’s static points may be adjusted (color, thickness, label properties, etc).
-
-
2. Configure the interaction’s response.
Click on the interaction’s Response tab.
In the interaction’s graph, select the points that create the correct graph. This response processing option supports automatic scoring. For more information on manual scoring, see https://oat-sa.atlassian.net/wiki/spaces/UGT/pages/2486632499/Scoring?atlOrigin=eyJpIjoiOGI2Zjk2NTczZDYwNGUzM2E3YjA3YjA4MTY1MzFhZjciLCJwIjoiYyJ9,
In the Response Properties, there is an option to enter the correct equation to be matched against what the test-taker produces in the graph. Check Switch to equation based scoring to enter the correct equation and the correlating score.
This option requires further configurations in the custom response processing editor.