
This article describes how administrators can enable and configure the Diagnostic Tool in System Settings.
The Diagnostic Tool is a TAO-provided utility that helps confirm whether an organization’s environment meets the requirements for a delivery. It runs a short set of checks (browser compatibility, network performance, endpoint reachability, real-time connection capability, and optional audio checks).
Enabling and configuring
The tool is configurable at the account level and can be tailored (via System Settings) to collect additional contextual information (such as workstation name or school) to support troubleshooting and analysis.
Account administrators can configure which fields and checks are included using the Diagnostic Tool editor in System Settings.
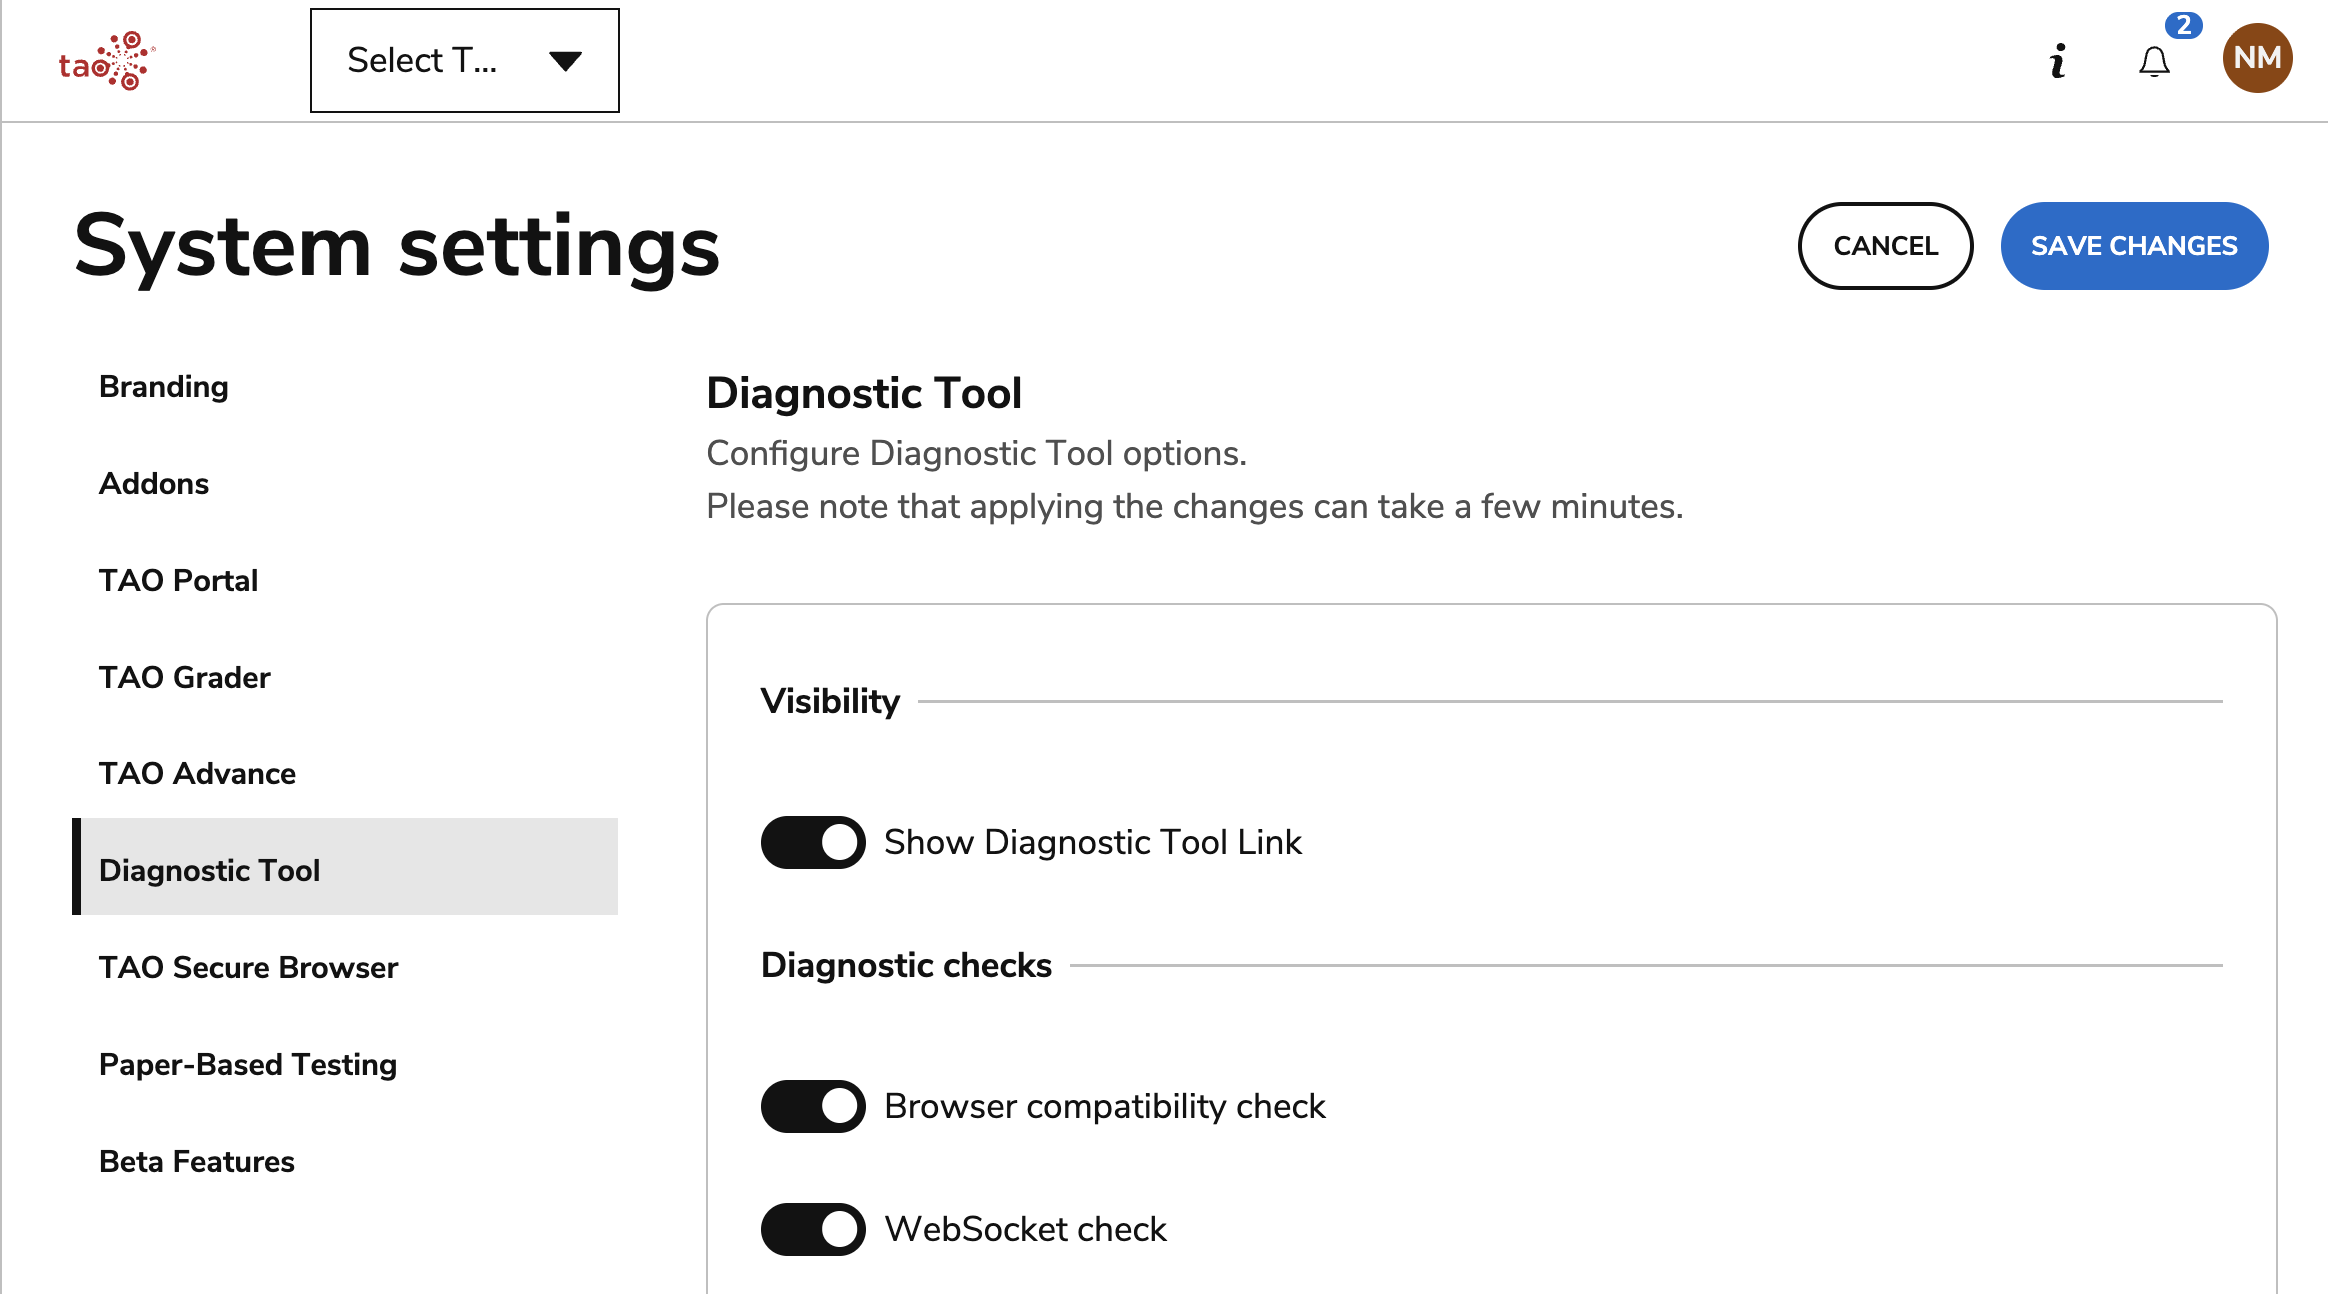
Use the toggles to enable the following configuration options.
1. Visibility
Enable the Diagnostic Tool link to be available on the TAO Portal login page (under System Diagnostic).
2. Configure diagnostic checks
Select which diagnostic elements you want to check for compatibility when running the tool:
-
Browser compatibility: Verifies that the user’s browser and version meet the minimum supported requirements to run TAO applications effectively.
Important: If the Lockdown Browser is enabled, then the browsers configured for the Diagnostic Tool are ignored and the Lockdown Browser takes precedence. For more information on browser diagnostic results, see Using the Diagnostic Tool.
-
WebSocket check: Tests the connection between the user’s browser and the server to ensure real-time communication is stable and supported.
-
Bandwidth: Checks whether the user’s internet connection can handle the required data transfer for optimal performance.
-
Audio checks
-
Audio bandwidth check: Evaluates whether the connection can support audio data transmission without interruptions.
-
Audio capability test: Verifies that the user’s device can properly record and play audio, including microphone detection and playback functionality.
-
Require audio tests: If enabled, audio checks run automatically. if disabled, the user must manually initiate the audio test.
-
3. Requirements for diagnostic tests
Minimum bandwidth requirements
Define the minimum network performance needed to ensure the platform runs smoothly. These thresholds determine whether a user’s connection is sufficient.
In the Bandwidth thresholds section, configure the following:
-
Download: The minimum speed required to receive data from the server.
-
Upload: The minimum speed required to send data to the server.
-
Latency: The maximum acceptable delay (in milliseconds) between sending and receiving data.
-
Concurrent users: The expected number of users sharing the network connection at the same time.
Minimum bandwidth requirements for audio
Define the minimum network performance required specifically for audio-related features, such as recording and playback.
Tests that contain audio often require higher bandwidth than standard tests because audio files are typically larger than text or image files. The audio bandwidth settings allow you to define separate thresholds to evaluate whether a user’s connection can support tests with audio.
The same applies to tests that contain video files.
In the Audio bandwidth thresholds section, configure the following:
-
Download: The minimum speed required to receive audio data.
-
Upload: The minimum speed required to transmit audio recordings.
-
Latency: The maximum acceptable delay for real-time audio communication.
-
Concurrent users: The number of users who may be using audio features simultaneously on the same network.
4. Browser requirements
Specify which browsers are supported and define the minimum version required for each.
All browser specified here must be a supported browser.
5. WebSocket configuration
Specify a connection timeout: This defines how long the system waits for a WebSocket connection to be established before failing. This value is set in milliseconds (ms), where 1,000 ms equals 1 second.
6. Adding descriptive metadata fields
When enabled and configured by the administrator, the Diagnostic Tool link is available on the TAO Portal login page (under System Diagnostic). Before running diagnostics, users must provide identifying information about their organization. This ensures the test runs according to the administrator’s configuration.
Administrators can customize which fields appear and whether they are required:
-
Add contextual input fields, such as:
-
Workstation name
-
School name
-
Country
-
-
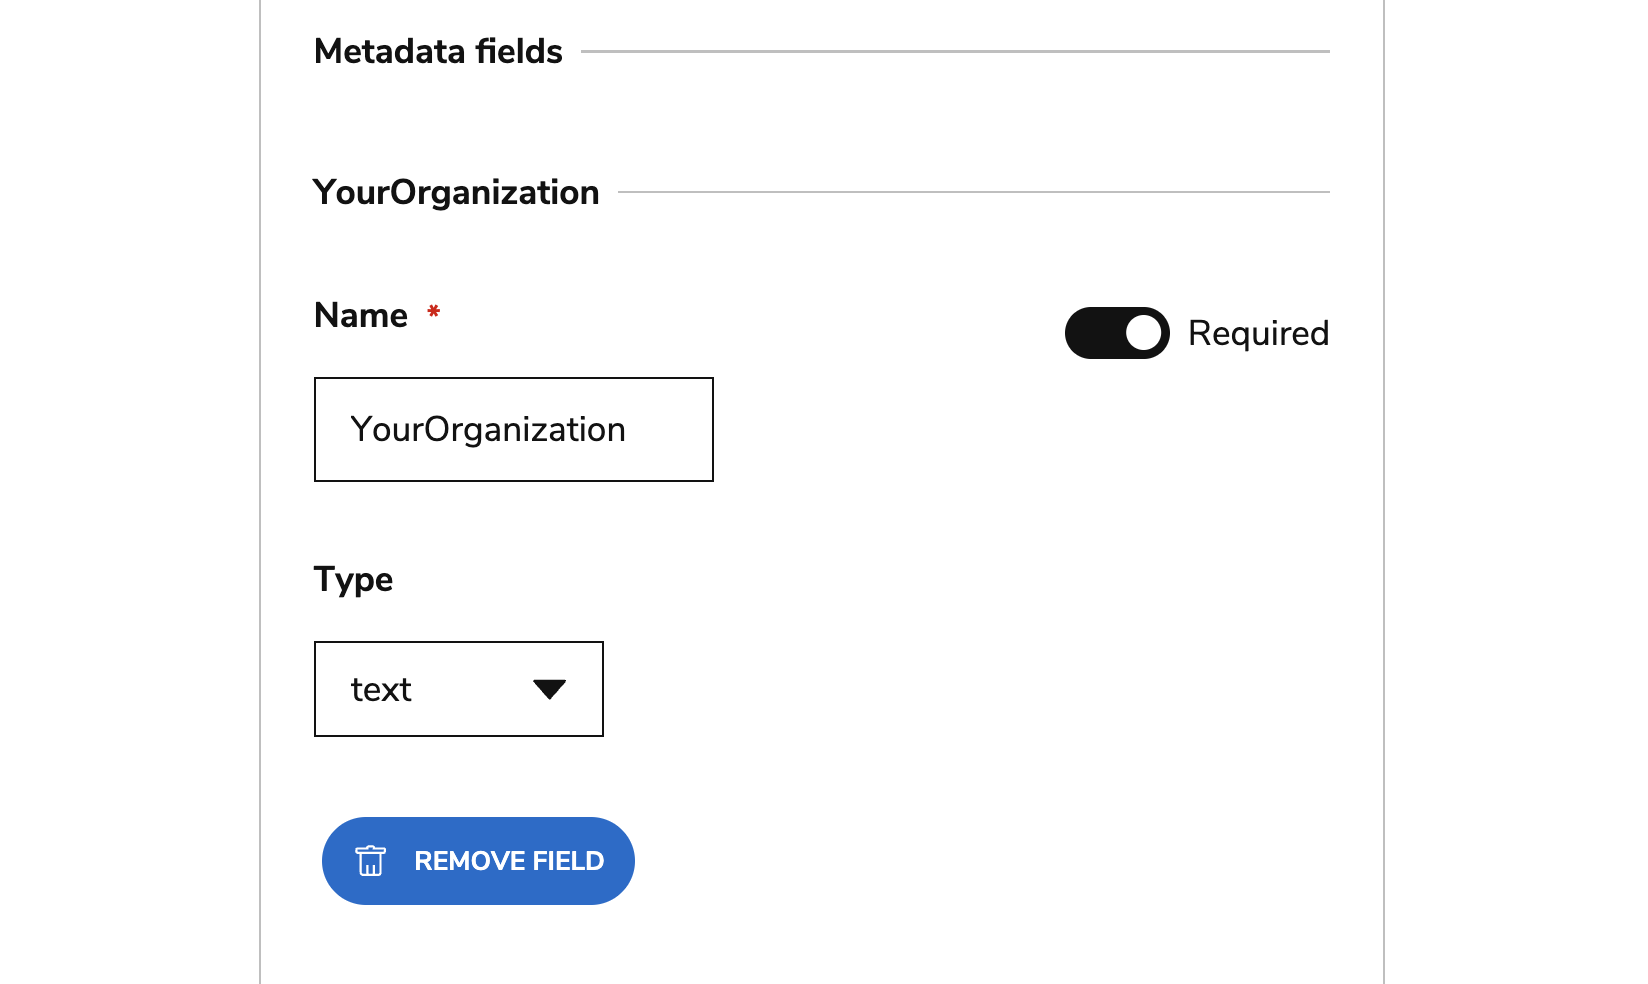
For each field:
-
Define the field name shown to the user.
-
Specify the input type (text or list).
-
If using a list, upload a CSV file containing all selectable options.
-
Mark the field as required if users must complete it before proceeding.
-
-
Add or remove additional custom fields as needed for your organization.
Example metadata field
What the administrator configures:
What the end user sees:
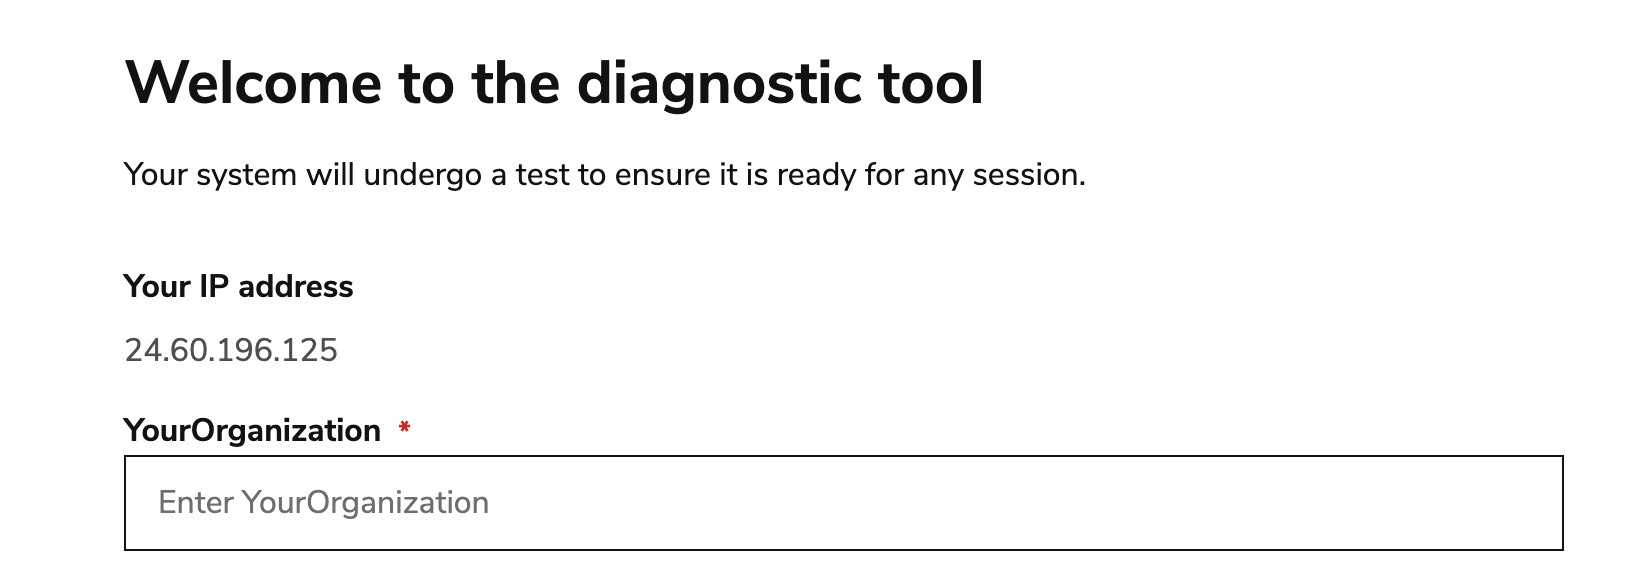
The Diagnostic Tool interface shown to users will reflect these settings. These metadata fields will also inform what will display in Data Explorer.
For more information on using the tool, see the following topics: