Viewing custom reports (TAO Insights)
The TAO Portal provides a beta version of a feature that allows admins to view and export detailed performance analysis capabilities for both groups and individual students across multiple sessions.
Enabling custom reports
Log in to the TAO Portal.
In the top-right corner of the Portal interface, select the circular button with your initials. In the menu that displays, select My account.
Navigate to the Beta Features tab.
Toggle the Beta features option.
Toggle the Custom reports option.
The Reports feature will display in the main menu of the TAO Portal, or via the top bar menu (Reports).

Reports feature
Viewing the reports
In the Reports section, select which area of the Portal you want to view from the drop-down menu. The options are the following:
System activity
Student performance
Group performance
Once you have selected an option, click Select Data to configure the parameters of your search.
Once you have configured the parameters of your report (see the sections below for more details), select Generate Report.
Once the report is generated, select Download PDF to export the report as a PDF file.
System activity
System Activity generates a report of the activity within your organization for a given timeframe. In the Select Data box, choose a start and end date to configure your report.
The default timeframe will be the date you are generating the report.
Overall status
This section displays how many test takers have started an assessment and how many test takers have submitted an assessment within your organization for the defined timeframe.
Test takers started
In this section, a line graph displays how many test takers started an assessment (for the defined timeframe) and on which day. This line graph provides a visual to analyze which days had a higher rate of test taker activity.
The bottom of the graph displays each day in the defined timeframe. On the left of the graph, each number represents the number of test takers.
Usage per day
In this section, each day within the defined timeframe is listed with the following details:
Start time per day (each day in the selected interval)
Started (number of assessments)
Submitted (number of assessments)
You can search a specific date to filter results.
Student performance
Student performance generates a report on a specific test taker. In the Select Data box, the following configuration options are available:
Opened/Closed on: This option allows you to confine the report results to a specific timeframe.
The default timeframe will be the date you are generating the report.
Test taker: The test taker for whom you want to generate a report. This selection is mandatory.
Groups: If a test taker is assigned to multiple groups, you can select those groups to narrow the search. If no groups are selected, the report will include each group they are assigned to.
Sessions: If a test taker is assigned to multiple sessions, you can select those sessions to narrow the search. If no sessions are selected, the report will include each session they are assigned to.
At the top of the report, the following details are available:
The defined timeframe
The amount of sessions the test taker has been assigned to
How many assessments were passed or failed
Average score ratio
This section’s graphic displays the test taker’s average score ratio across all assessments they have completed.
Student performance per session
In this section, each assessment the test taker has submitted is listed with the following details:
Name (of session)
Group
When the assessment was submitted
The test taker’s score
The highest score achieved by a test taker within the session (not necessarily the test taker in the report)

Student performance report
You can select each session’s name to enter the session overview page. For more information, see Entering a session's overview page.
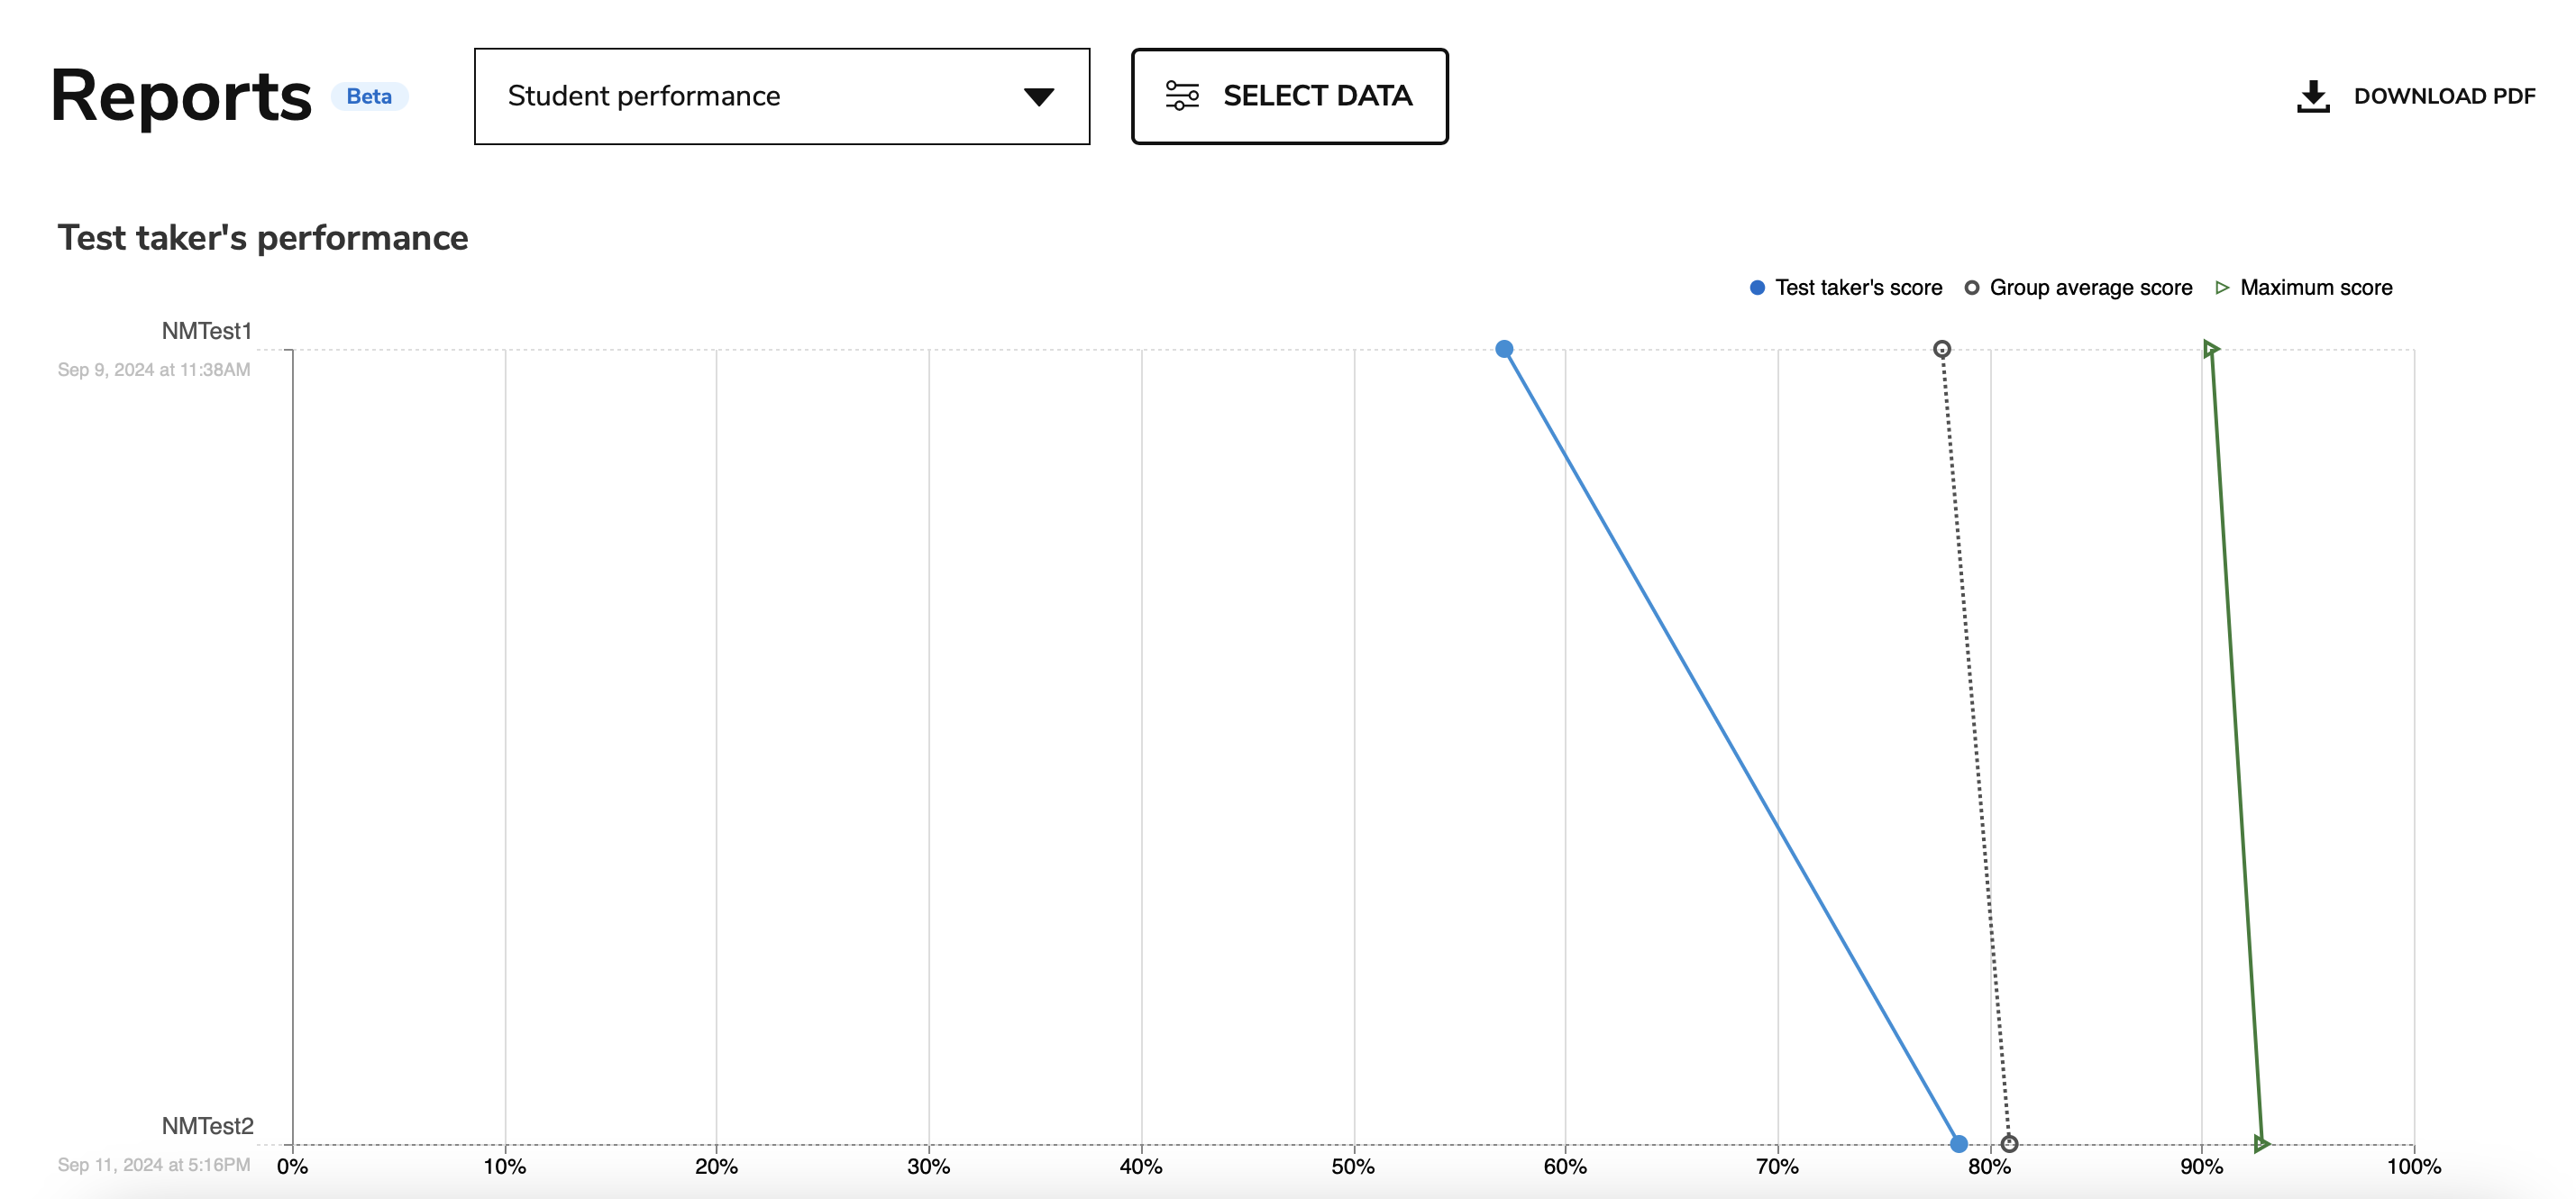
Test taker’s performance
This section’s graphic displays how the test taker’s score compares to the group average and maximum score of each session they have submitted in a line graph.
The bottom of the graph displays the percentage of each defined score. On the left of the graph, each session is listed with the time it was submitted (by the test taker). The group average score and maximum score (per session) are also displayed.

Test taker performance line graph
Group performance
Group performance generates a report on a specific group. In the Select Data box, the following configuration options are available:
Group: The group for which you want to generate a report. This selection is mandatory.
Test takers: You can select individual test takers to narrow the search. If no test takers are selected, the report will include each test taker assigned to the group.
Sessions: You can select specific sessions to narrow the search. If no sessions are selected, the report will include all sessions the group has been assigned to.

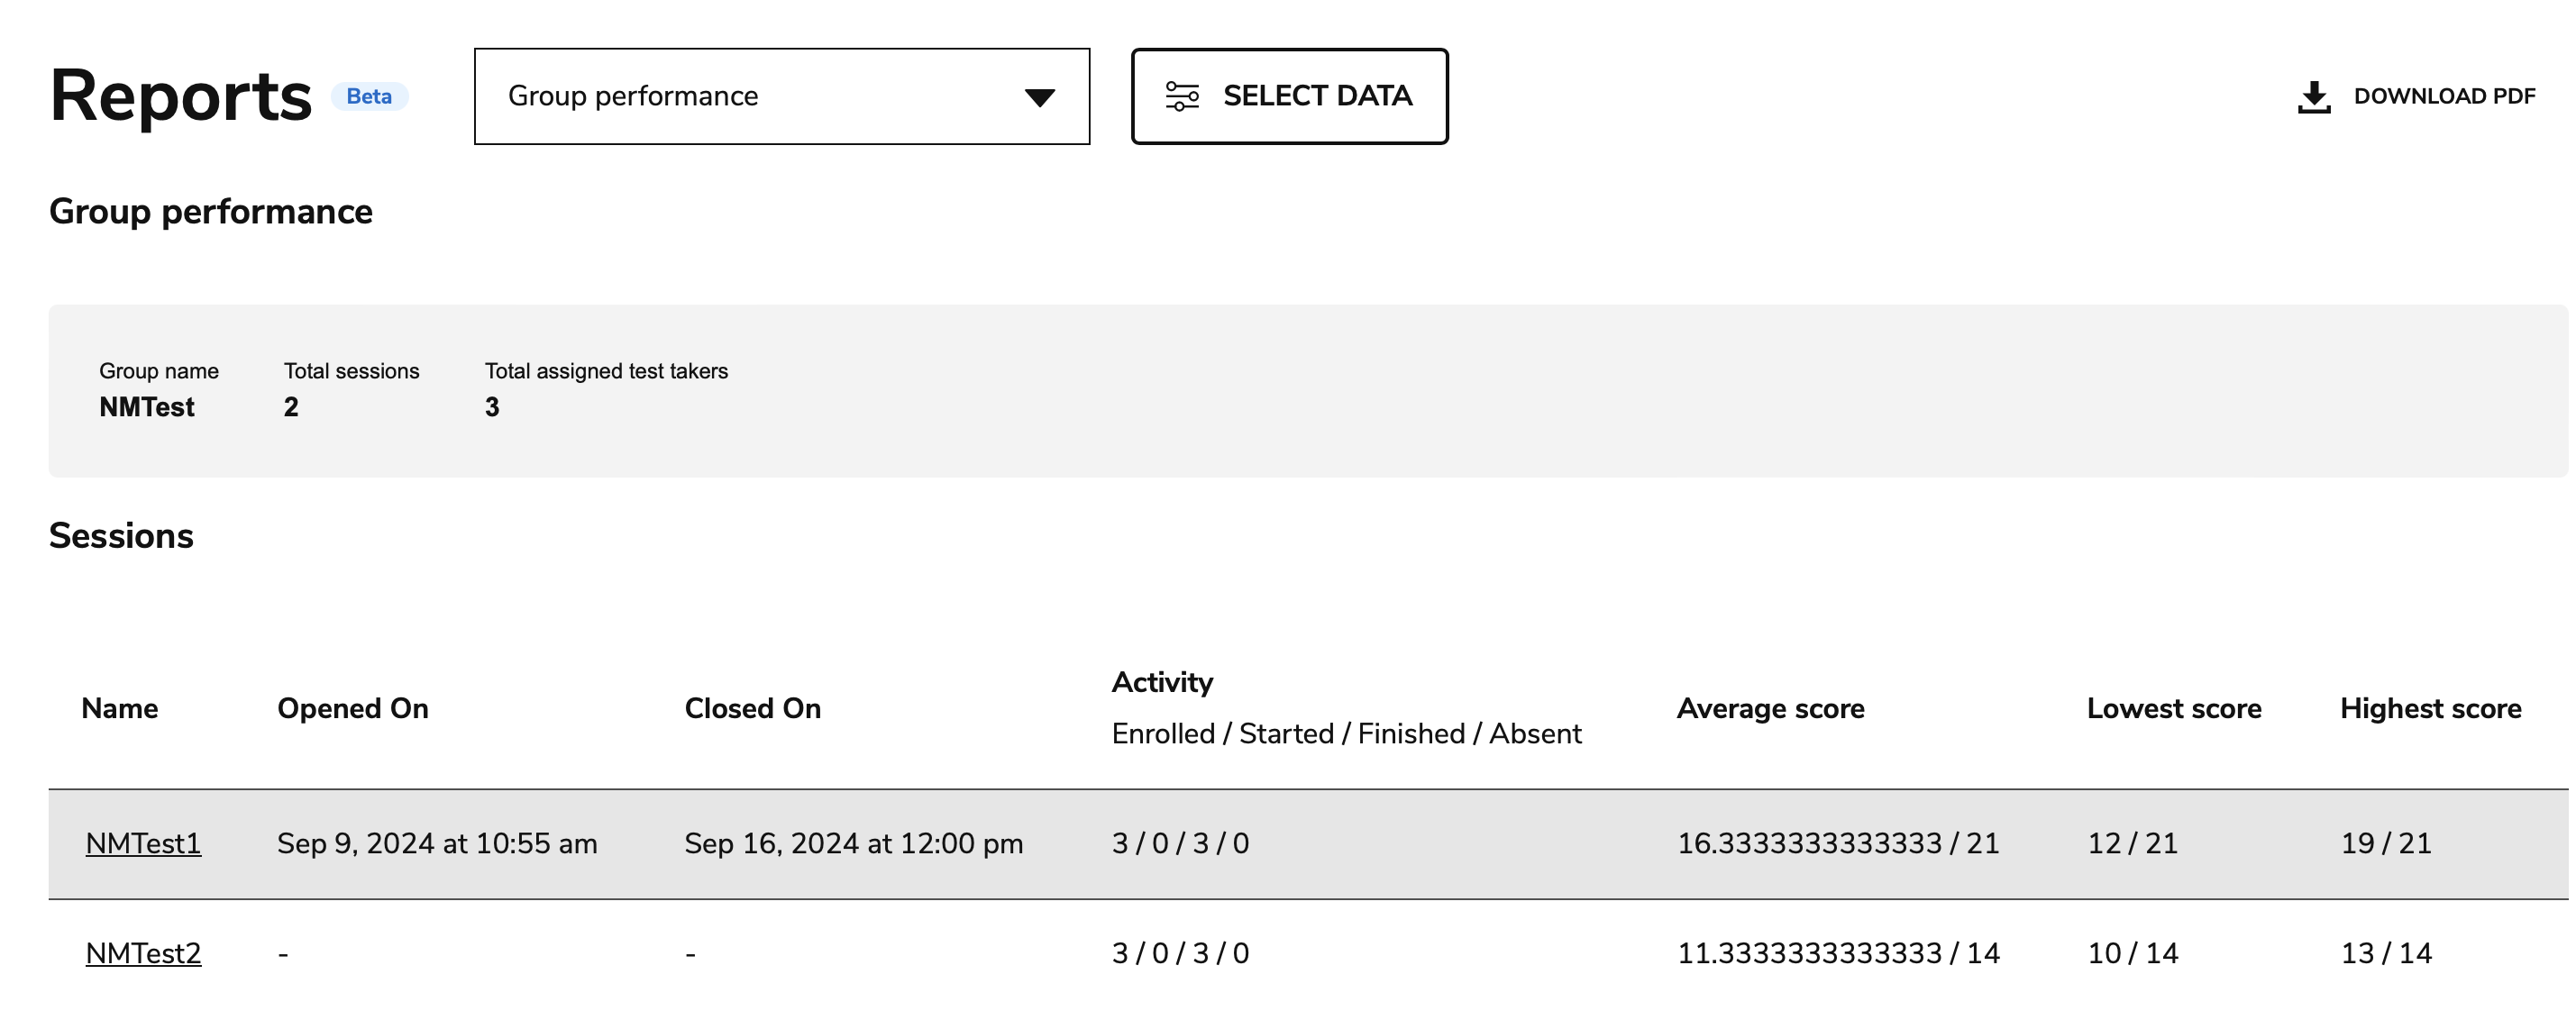
Group performance report
At the top of the report, the following details are available:
Group name
Total sessions (the group has been assigned to)
Total assigned test takers
Sessions
In this section, each session the group has been assigned to is listed with the following details:
Name (of session)
Opened on
Closed on
Activity (how many test takers were enrolled in, started, finished, and missed the session)
Average score
Lowest score
Highest score
You can select each session’s name to enter the session overview page. For more information, see Entering a session's overview page.
