
The Item Statistics report feature provides educators, test administrators, and item creators with detailed analytical data on item performance. Analyzing item performance assists in improving the quality and effectiveness of assessments.
Prerequisites
This feature is only available for TAO Ignite (as a part of TAO Advance).
Accessing Item Statistics
-
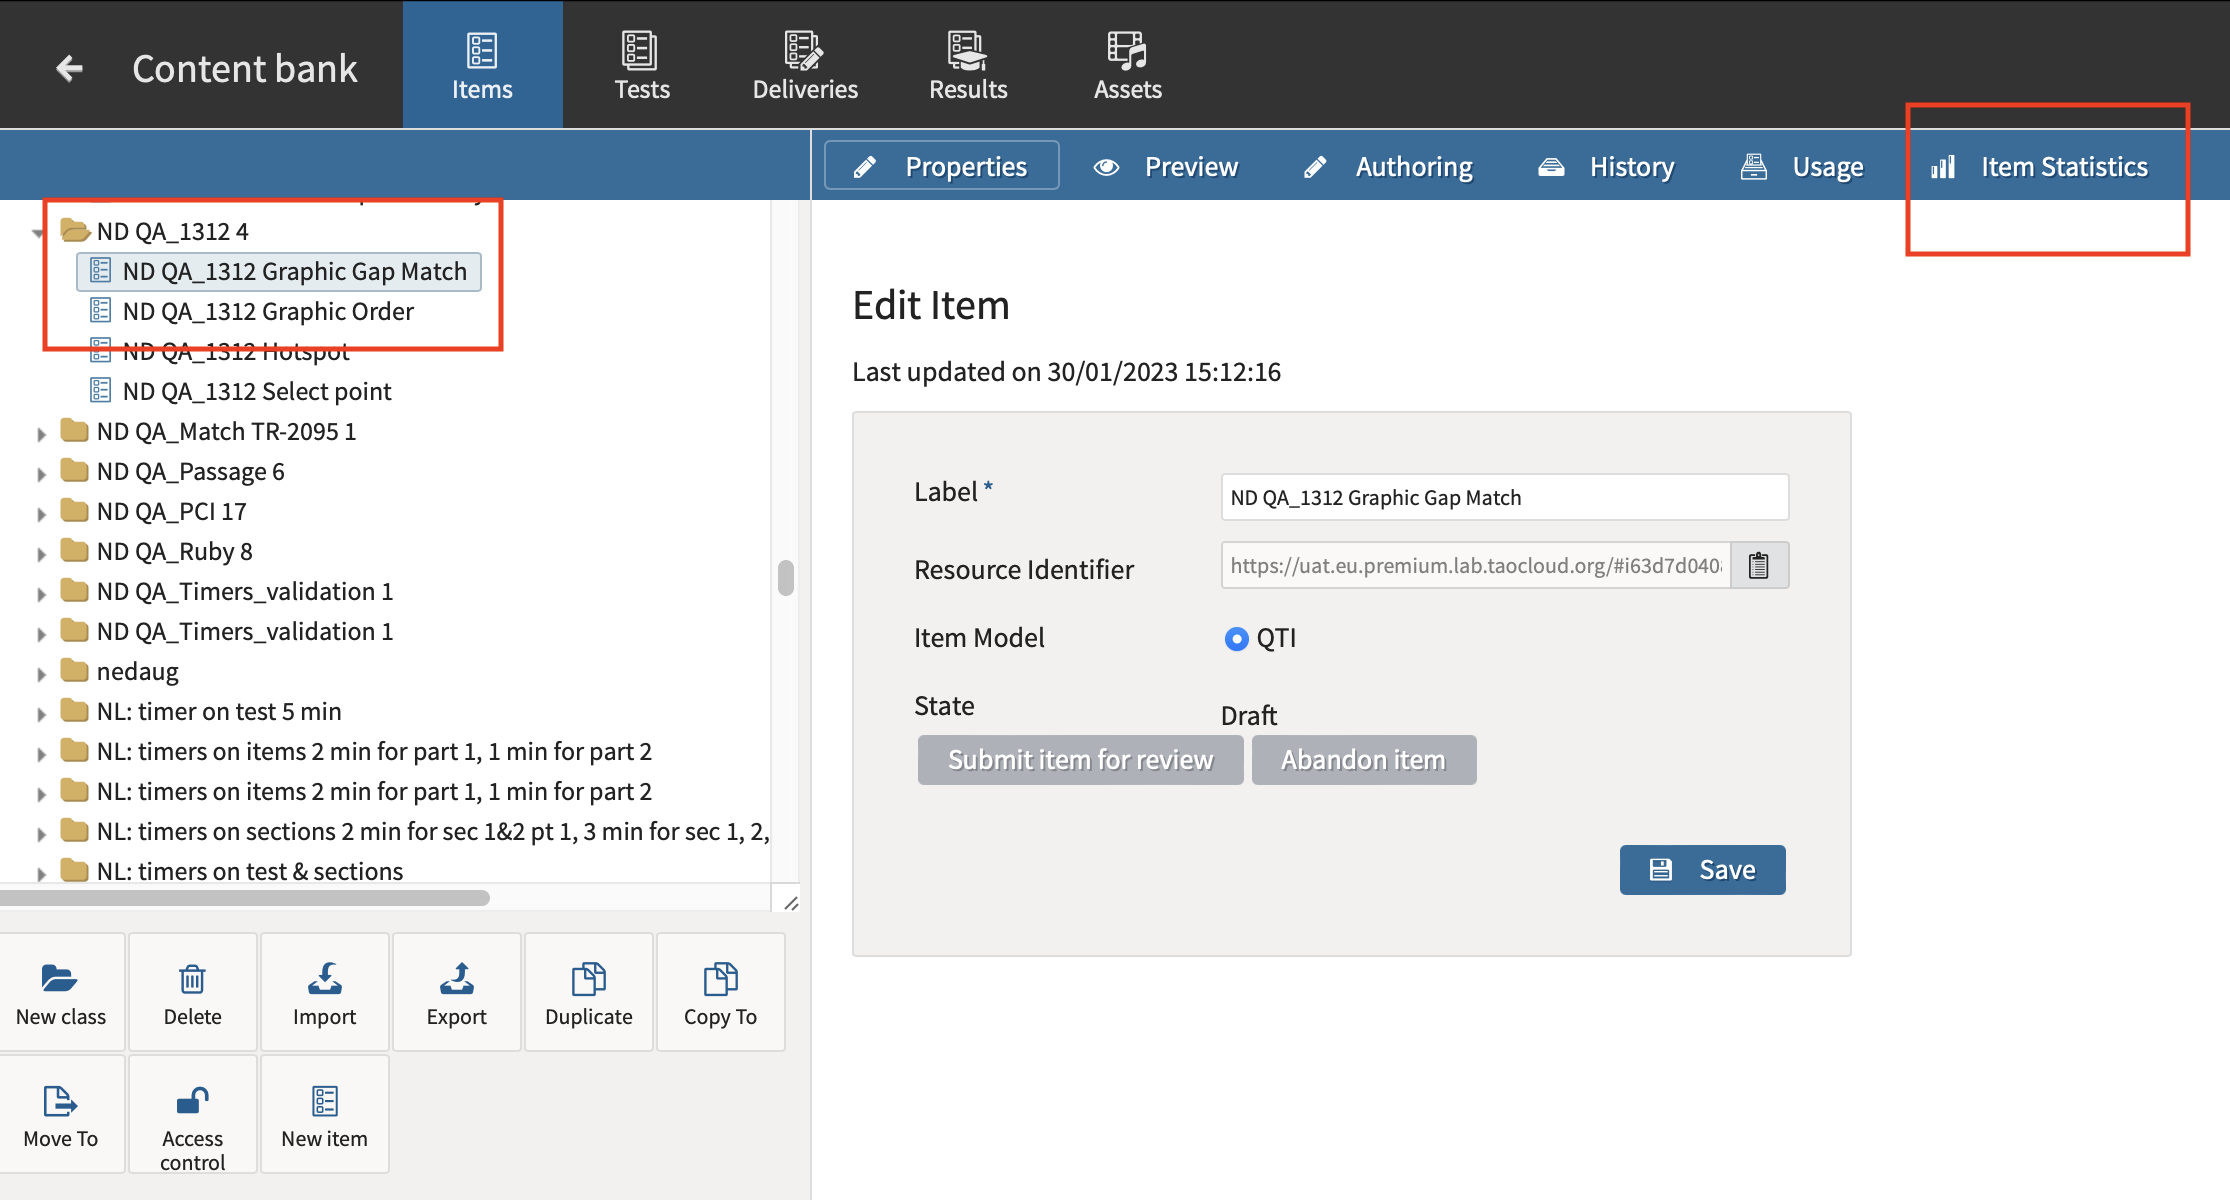
Navigate to the Content Bank.
-
In the Items window, select an item in the menu on the left of the interface.
-
To view the item’s statistics, select Item Statistics.
The report displays two tables with different metrics for analyzing the item:
Table 1. Executions
The Executions table displays the following details on the item’s executions:
-
Number of executions: The number of times the item’s interaction was executed by a test taker.
-
Correct: How many times the item’s question was answered correctly.
-
Incorrect: How many times the item’s question was answered incorrectly.
-
Skipped responses: How many times the item was skipped by test takers.
Table 2. Performance Statistics
The Performance Statistics table offers generated calculations on the item’s difficulty and discrimination:
-
Difficulty: Percentage of correct answers out of the total number of executions for the item.
-
Discrimination: The ability of a test question (or item) to differentiate between high-performing and low-performing test-takers. Discrimination measures how well an item distinguishes between individuals who have a high overall ability or knowledge in the subject being tested and those who do not.
-
High discrimination means that the item is answered correctly more often by those with high overall test scores than by those with low overall test scores. This helps ensure that the test is effectively measuring what it is intended to measure. Higher values are better (1 = perfect correlation). The item is perfect at distinguishing between high and low performers. High scorers on the test are much more likely to get this item correct than low scorers.
-
0 = no correlation. The item does not effectively distinguish between high and low performers. Both groups are about equally likely to get the item correct.
-
-1 = perfect negative correlation. The item is very problematic, as low performers are more likely to get it correct than high performers. This could indicate a flaw in the item or a misunderstanding of the content by high scorers.
-
-
Standard deviation: The total standard deviation of test scores across all test takers for the test that includes this item. A higher value indicates greater variation in overall test scores.
-
Standard deviation for correct answers: The standard deviation of the test scores among test takers who answered this item correctly. A low value suggests that high-performing test takers tend to answer correctly consistently.
-
Standard deviation for incorrect answers: The standard deviation of the test scores among test takers who answered this item incorrectly. A high value here may indicate that even high-performing test takers sometimes get this item wrong, suggesting potential ambiguity or misalignment in the question.
Interpreting the Item Statistics Metrics
The Performance Statistics in the report help you understand how effectively each item contributes to measuring what the assessment is intended to evaluate. Each metric provides a different perspective on item quality and test reliability.
Difficulty
-
The Difficulty value represents the percentage of test takers who answered the item correctly.
-
A higher percentage means the item was easier (more participants got it right).
-
A lower percentage means the item was more difficult (fewer participants got it right).
-
Ideally, an assessment should include a mix of easy, medium, and difficult items to differentiate between various levels of ability.
-
Example interpretation:
-
A Difficulty around 50% is generally desirable; it suggests the item is neither too easy nor too hard and can effectively discriminate between stronger and weaker test takers.
-
A Difficulty above 80% may indicate an item that is too easy.
-
A Difficulty below 20% may indicate an item that is too hard or potentially confusing.
-
Discrimination
-
Discrimination measures how well the item differentiates between high-performing and low-performing test takers.
-
It is expressed as a correlation coefficient (ranging from -1 to +1):
-
+1 indicates perfect discrimination: only high performers answered correctly.
-
0 indicates no discrimination: both high and low performers were equally likely to answer correctly.
-
-1 indicates negative discrimination: low performers were more likely to answer correctly, suggesting a flaw in the item.
-
-
A higher discrimination value (typically above 0.2) indicates that the item contributes positively to the test’s ability to measure differences in knowledge or ability.
-
Low or negative discrimination suggests that the item may not align with the test objectives, could be misleading, or might require review.
Standard Deviation Metrics
The Standard Deviation metrics provide insight into how much the overall test scores vary among test takers in relation to a specific item.
While these metrics are displayed at the item level, they are calculated based on all tests that include the current item. This helps you understand how consistently the item behaves across different contexts and populations.
|
Metric |
Interpretation |
|---|---|
|
Standard deviation |
Indicates the total variation of test scores across all test takers who encountered this item, regardless of whether they answered it correctly or incorrectly. A higher value means that the test scores of those who saw this item vary widely, suggesting the item appears in tests with a broad performance range. |
|
Standard deviation for correct answers |
Measures how much the total test scores vary among test takers who answered the item correctly, across all tests where the item appeared. A low standard deviation indicates that those who got the item right tend to have similar (typically high) overall test scores, showing good item consistency and positive discrimination. A high standard deviation means the item was answered correctly by test takers with varying ability levels, potentially reducing its discriminative power. |
|
Standard deviation for incorrect answers |
Measures how much the total test scores vary among test takers who answered the item incorrectly, across all tests where the item appeared. A low value suggests that those who got it wrong generally have lower overall scores, supporting good item discrimination. A high value may indicate that even high-scoring test takers sometimes miss the item, suggesting possible ambiguity, misalignment, or wording issues. |