
Data Explorer is a beta feature which allows administrators to retrieve raw data from TAO Insights via the Portal’s user interface. Previously, this data could only be fetched via an API query.
What is Data Explorer
Data Explorer provides a centralized location to search for raw data pertaining to selected entities in the Portal. Users have access to an extensive list of filters to assist in narrowing down their search. This data can then be exported as a CSV file.
How to use Data Explorer (with examples)
This section will describe the basic steps of configuring Data Explorer to run a query, and provides an example of a configuration.
1. Select the entity you want to retrieve data for.
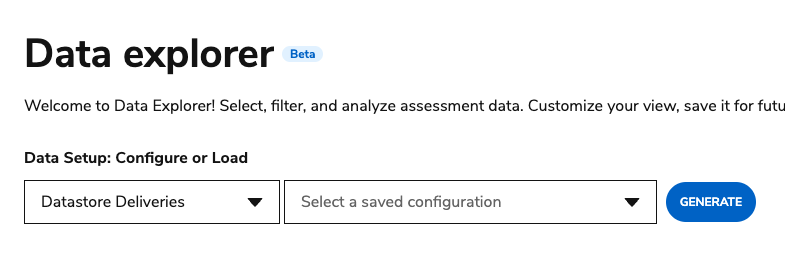
From the Data Setup: Configure or Load dropdown menu, select which entity you want to retrieve data for. Entities available for selection are restricted according to role.
The entity selection in this dropdown menu contains options to retrieve data on delivery results, system logging for user activity within the Portal, and other technical specified sets of data. The entity chosen in this step will impact what options are presented in the Filter and Display tabs (steps 2 and 3).
For more information on each entity, see Data explorer entities.
Example
In this example, the Datastore Deliveries entity is selected. This means that the query will return fields associated with deliveries. It will not include other type of data, such as results for sessions, which are typically found in other tables.
2. Select filter(s) for which fields you want to use to narrow down your search.
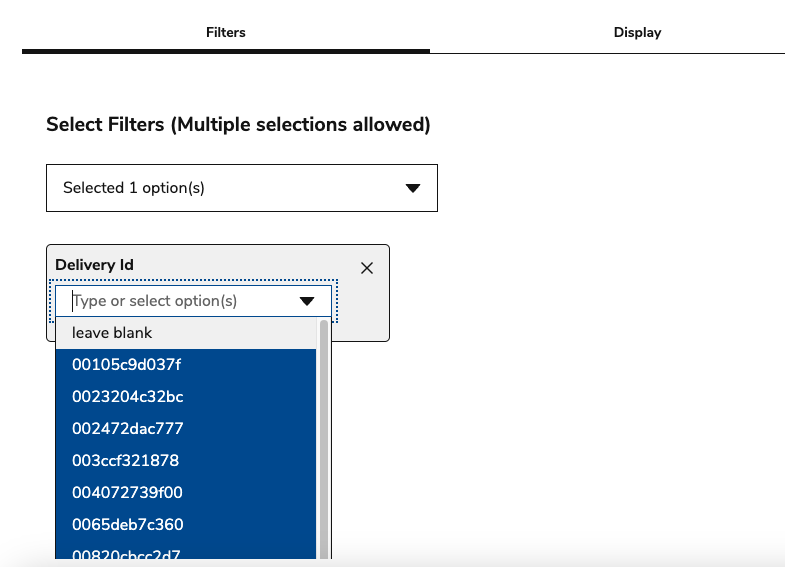
Under the Filters tab, select all fields related to the selected entity that you want to include in the data query. The filters tab is restricting (filtering) the results that will be generated, but not the fields (columns) that would be displayed for them.
The Filters are meant to narrow down your search to find specific types of information. For each filter you choose, you can provide a value(s) (i.e delivery IDs).
Example
The filter allows you to narrow the data you will receive to specific elements that make up the type of data you selected. In this example, for Datastore Deliveries, you can run a query with a filter on delivery ID. When this filter is selected, you can enter delivery IDs manually or select one or more from the dropdown menu. Only these deliveries will display in the results.
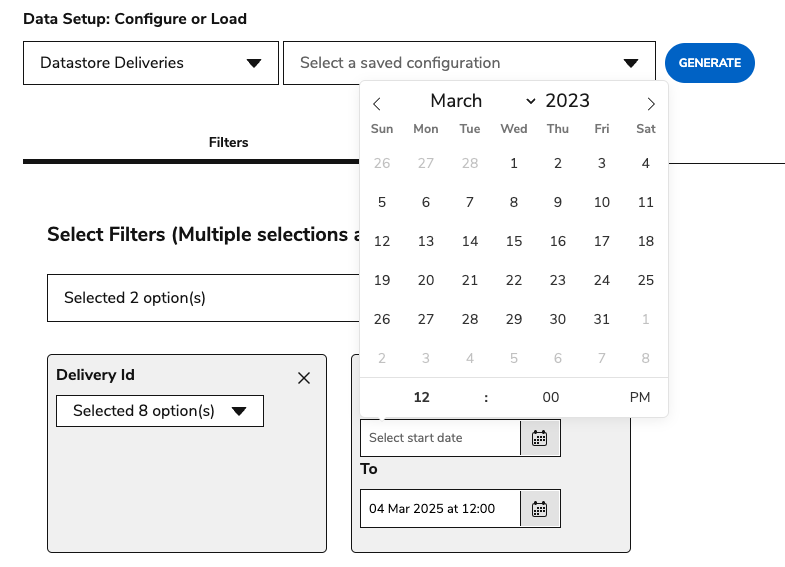
You can select multiple filters. In this example, the search will also be narrowed down to deliveries published within a set time frame.
3. Select which fields you want to display in your results.
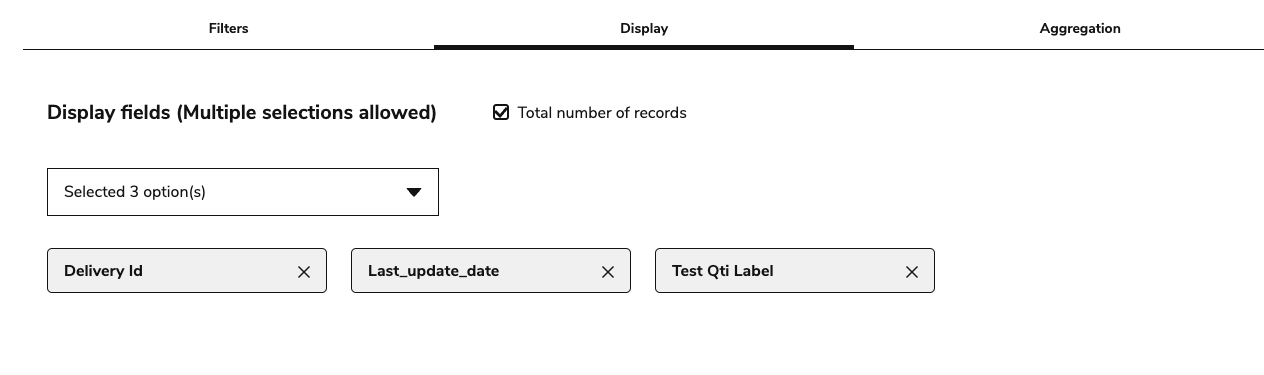
Under the Display tab, select the fields you want to display in your results. Like filters, selecting display fields allows you to request specific sets of data; the fields selected here restrict the results to specific elements of the entities selected within the scope of any applied filters.
Select the Total number of records box to display the number of records in the search once the query is generated.
Before selecting any Display fields, you can select Enable all (at the right of the screen) to enable all fields. Once fields have been selected, you can select Disable all to disable those fields selected from the results (leaving all unselected fields to be included).
Example
In this example, the Display fields selected are: Delivery Id, Test QTI Label, and Last_update_date.
When the results are generated, they will display data for the selected delivery IDs that were published in the selected timeframe. The fields selected for Display designate which specific data points of those results are generated; in this case, it would be the delivery ID, the test QTI label, and the last update date of the deliveries included in the results.
4. Select Generate.
You must have one or more field selected in the Display tab in order to generate results.
Large data requests (such as not selecting a filter or enabling all Display selections) will result in an error. If this occurs, try to refine your search by filtering the results or reducing the number of displayed fields.
Once you have generated the results, you can view and/or adjust the filters applied by selecting Show filters and Apply changes on filter options.
To save a query configuration, type a name for the configuration and click Save Configuration. Saving a configuration allows you to run the same query at a later point to receive an updated data set with the same filters. Toggling the Make public option allows anyone using data explorer can use the saved configuration.
Select See Configurations to manage (and delete) previously saved configurations for the selected entity.
Select Download CSV to download a CSV file of the search results.
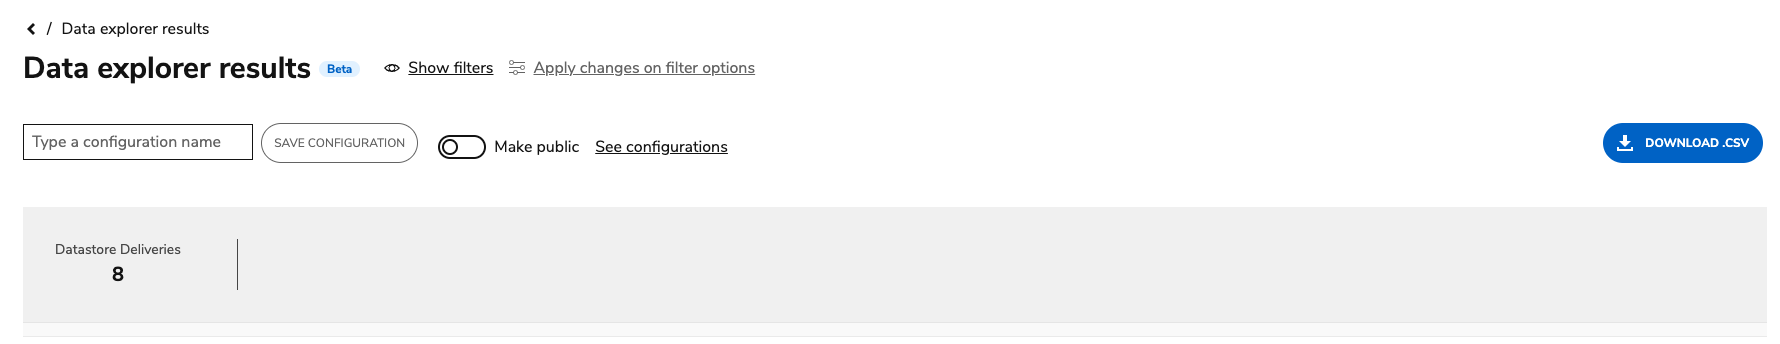
Example
If you selected Total number of records, the number will display above the results table.
Advanced configuration options
Aggregation
In the Aggregation tab, you can select a field for which you want to displays statistics, or a count for that particular field. The count will display to the right of the field in the results table.
In order for the aggregation calculations to work, the selected aggregation field must match one of the fields selected in Display.
For example, if you:
-
Select Datastore Delivery Results as the entity
-
Set a filter to several deliveries IDs
-
Set the Display to Delivery ID, Delivery Execution ID, and Login
-
Set the aggregation to Delivery ID
The results will display a table with a Count column; each number in that column displays the amount of results for that Delivery ID.
If you select a date field for Aggregation, no other fields can be selected for the displayed results.
Accumulation
The Accumulation option allows you to extract data from the results of a query where Aggregation fields have been set.
For example, if you select DeliveryID in both the Display and Aggregation tabs, you could then set the Accumulation field to Score and check Average in the menu. The results will display the average score for each Delivery ID.
Defining patterns for data extraction
When you select a field which contains an object data structure, you can define one pattern to filter which properties are extracted and shown as columns. For example, if the response field contains the following data:
"responses": [
                {
                    "lennon": {
                        "correct": false,
                        "value": "choice_a3"
                    }
                },
                {
                    "mccartney": {
                        "correct": true,
                        "value": "choice_b2"
                    }
                },
                {
                    "starr": {
                        "correct": false,
                        "value": null
                    }
                },
                {
                    "harrison": {
                        "correct": false,
                        "value": "choice_c2"
                    }
                }
            ],
The column card will display an input box to allow selecting which value to retrieve.
-
*.value: shows only thevalueproperty for each interaction -
*.correct: shows only thecorrectproperty for each interaction -
*.*or*: shows all properties for each interaction
Since only a single pattern can be entered in the Responses field, choose a pattern that best matches your reporting needs.